The Illusion of Causality in Charts
created: May 28, 2025, 5:49 p.m. | updated: May 31, 2025, 9:34 p.m.
A while back, I wrote an article here titled “Implied Causality in Line Charts.” The article examined the notion that certain charts imply a causal relationship between an event and an outcome, when such a relationship may not actually exist.
Three ways in which line charts can suggest a (misleading) causal effect,When I finished writing that post on line charts, I knew that I wanted to generalize the idea to a much broader set of charts and that some overarching principles must exist that cover most, if not all, charts.
In all these examples, I used simple bar charts; however, all variations of bar charts, including stacked, diverging, and grouped bars, can potentially lead to implied causality through similar mechanisms.
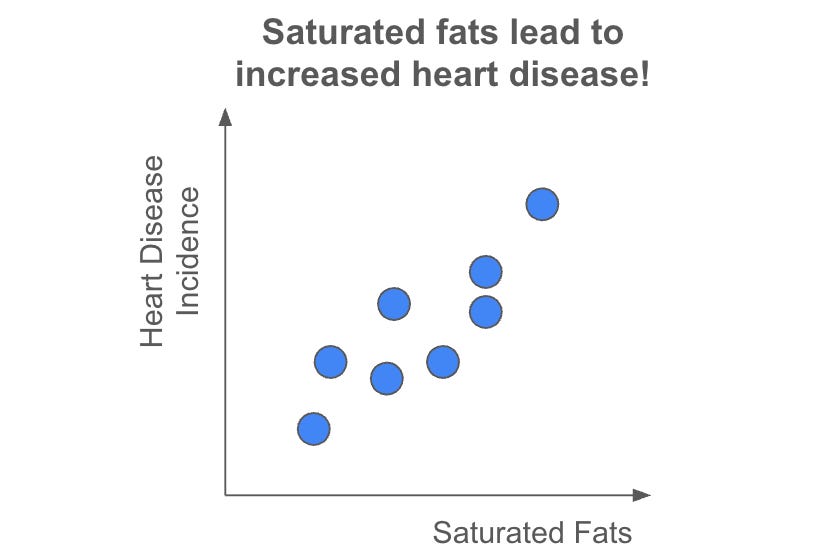
For example, all charts can imply causality by comparing two groups that differ by a given factor.
Event: The causality effect derives from the comparison of the state of the world before and after an event takes place.
1 week, 4 days ago: Hacker News