A Visual Introduction to Machine Learning (2015)
created: March 15, 2026, 10:47 a.m. | updated: March 16, 2026, 9:48 a.m.
A Visual Introduction to Machine Learning : English Bahasa Indonesia Deutsch Español Français Italiano Português Türk ελληνικά русский لعربية 中文 简体 In machine learning, computers apply statistical learning techniques to automatically identify patterns in data.
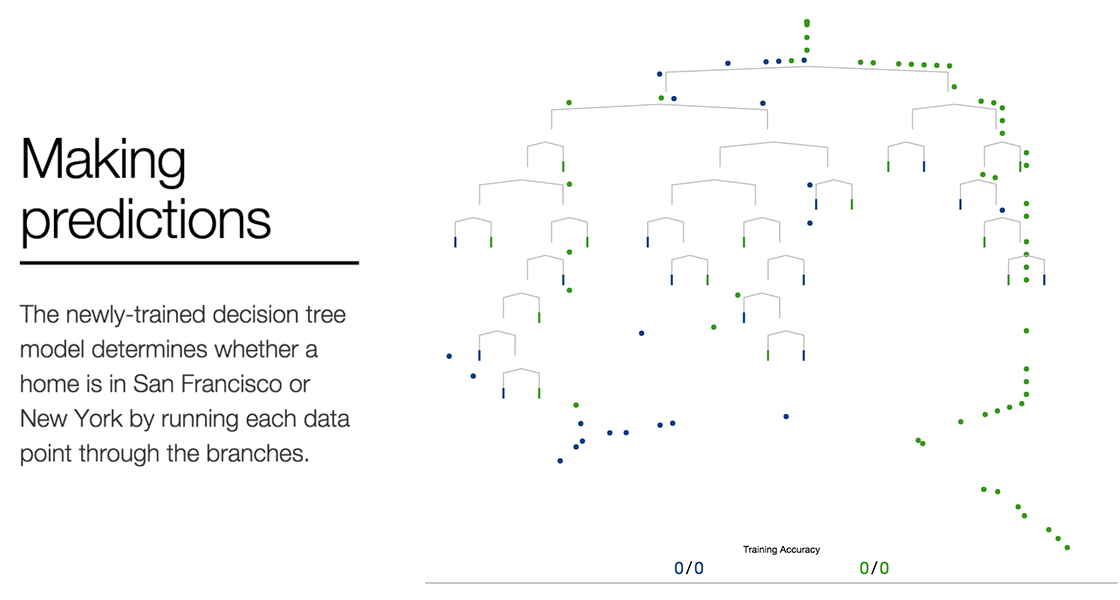
Using a data set about homes, we will create a machine learning model to distinguish homes in New York from homes in San Francisco.
In machine learning terms, categorizing data points is a classification task.
So visualizing elevation and price per square foot in a scatterplot helps us distinguish lower-elevation homes.
Of course, you'll need additional information to distinguish homes with lower elevations and lower per-square-foot prices.
23 hours, 25 minutes ago: Hacker News